Dashboard
The Dashboard is where CLACOROO opens. It’s a long, scrollable page that summarises everything CLACOROO knows about your Claude Code setup — and where you start most sessions.
Overview
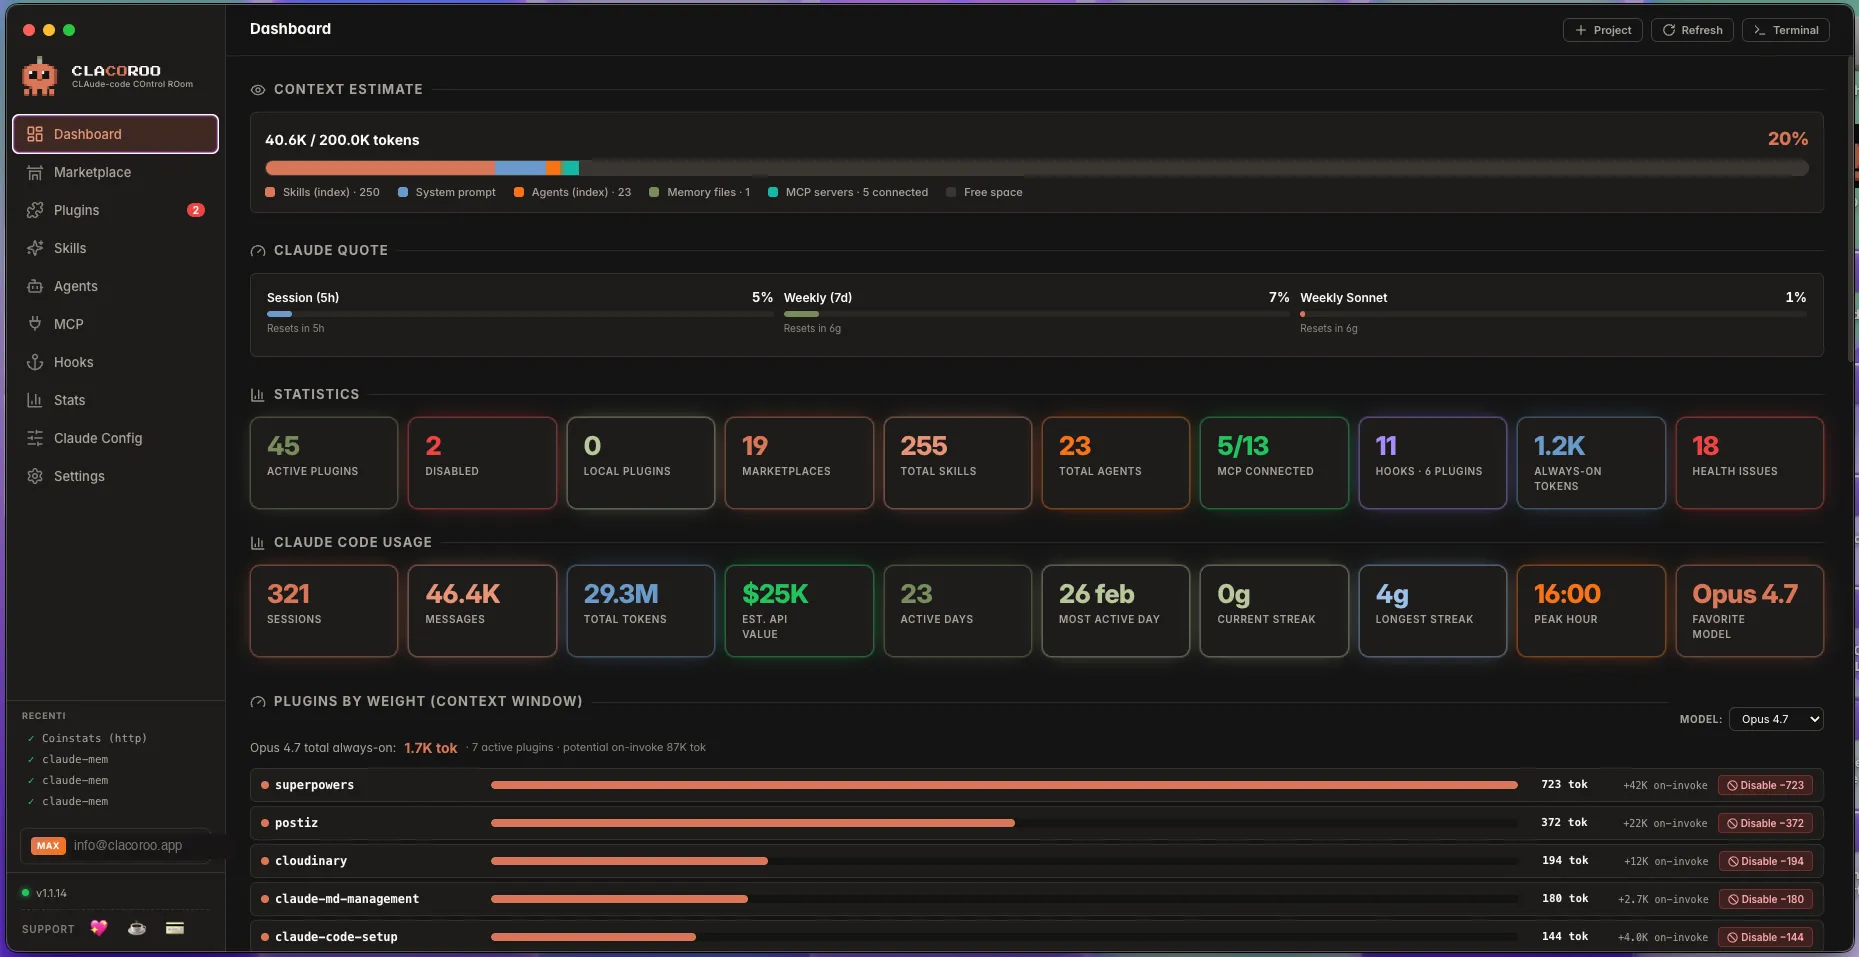
Three layers, from top to bottom:
- Context estimate — what’s filling your prompt right now, by category, with a coloured bar
- Claude quote — your live quota status (Session, Weekly, Weekly Sonnet)
- Statistics + lists — KPI cards, then a recap of every section in the sidebar (Marketplaces, Plugins, Skills, Agents, MCP servers, Hooks, recent activity)
The whole page is live: when files in ~/.claude/ change (because you ran a CLI command, or another tool wrote something), the numbers refresh on their own.
What it shows
Context estimate
A colored stacked bar represents the current prompt context broken down by source. Five categories, each in its own color:
- Skills (index) — token cost of your installed skills
- System prompt — fixed Claude Code system prompt
- Agents (index) — token cost of your installed agents
- Memory files —
CLAUDE.mdfiles loaded for the current project - MCP servers — how many MCP servers are connected, and their announce cost
Below the bar you see the absolute number (e.g. 40.6K / 1.0M tokens · Opus 5) and the percentage of the model’s context window already used. The window follows the model selected in Plugins by weight: 1M for Opus 5, Sonnet 5 and Fable, 200K for Opus 4.x, Sonnet 4.6 and Haiku (Opus 4.x and Sonnet 4.6 reach 1M only with the [1m] variant).
If a category cost grows unexpectedly, you usually find the culprit in the Plugins by weight list further down.
Claude quote
Three live progress bars for the three quotas Claude Code reports:
- Session (5h) — short-window rate limit, resets in minutes
- Weekly (7d) — your overall weekly quota
- Weekly Sonnet — model-specific weekly quota for Claude Sonnet usage
Each bar shows a percentage and a “resets in” countdown. If you don’t see this section, you’re not logged in to claude.ai (or your API key is configured instead — see Claude account).
The same three values also sit in the header, next to the page title, on every section (e.g. Session 36% · Weekly (7d) 7% · Weekly Sonnet —), so you can keep an eye on them without coming back here. Percentages turn amber at 80% and red at 95%; hover for the reset countdowns and the last update, click to jump to the Dashboard. It reads the same data the Dashboard fetched, on the same cadence: no extra API calls.
Statistics
A row of KPI cards, each focused on one number:
| KPI | What it counts |
|---|---|
| Active plugins | Globally enabled plugins (excluding local-scope and disabled ones) |
| Disabled | Plugins you have disabled but kept installed |
| Local plugins | Plugins scoped to the current project only |
| Marketplaces | Number of marketplaces you’ve registered |
| Total skills | Skills across all installed plugins |
| Total agents | Agents across all installed plugins |
| MCP connected | X / Y — connected servers over total registered |
Hooks (or Hooks · N plugins) | Total hooks, with the number of plugins that provide them |
| Always-on tokens | The cost (in tokens) of everything that’s always in your context |
| Health issues | Skills, agents and commands with a problem: invalid front matter or a broken link (items of a disabled plugin don’t count), minus those you ignored in the Doctor. A click opens the Doctor |
| Hooks with missing deps | Conditional: shows only if some hooks depend on CLI tools you don’t have installed |
KPI cards that act as shortcuts are clickable: clicking the Hooks card jumps to the Hooks section, the MCP card jumps to MCP, and so on.
Claude Code usage
A second row of cards, this time about history rather than the current state. The section title states the period they cover: all time, since the first day recorded on this machine (the Stats section lets you narrow to 30 or 7 days).
- Sessions — total Claude Code sessions on this machine
- Messages — total messages exchanged
- Total tokens — across every session
- Est. API value — what those tokens would have cost on the pay-as-you-go API
- Active days — how many days you’ve actually used Claude Code
- Most active day — the date of your single busiest day
- Current streak / Longest streak — consecutive days of use
- Peak hour — the hour of the day you use Claude Code the most
- Favorite model — the model with the most tokens (input + output) in the period; hover the card for this definition
All of these are computed locally from the session JSONL files Claude Code writes to disk. CLACOROO makes no API call to compute them.
Plugins by weight, marketplaces, recent activity
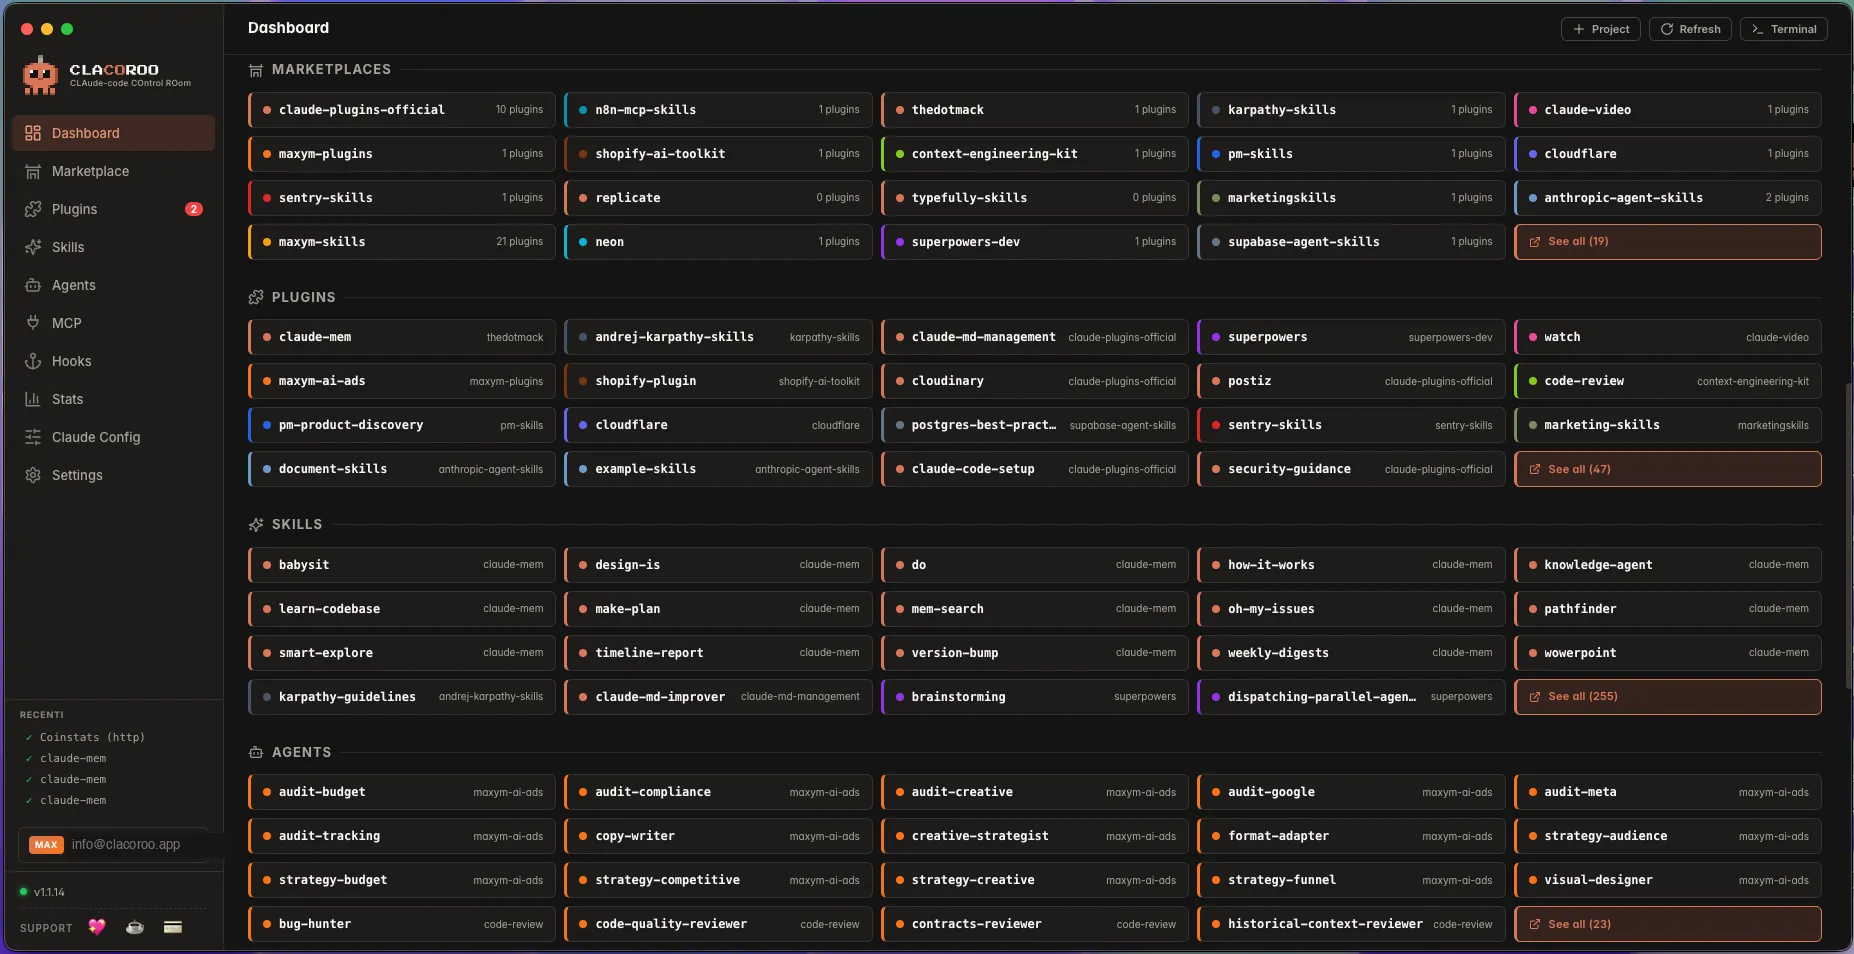
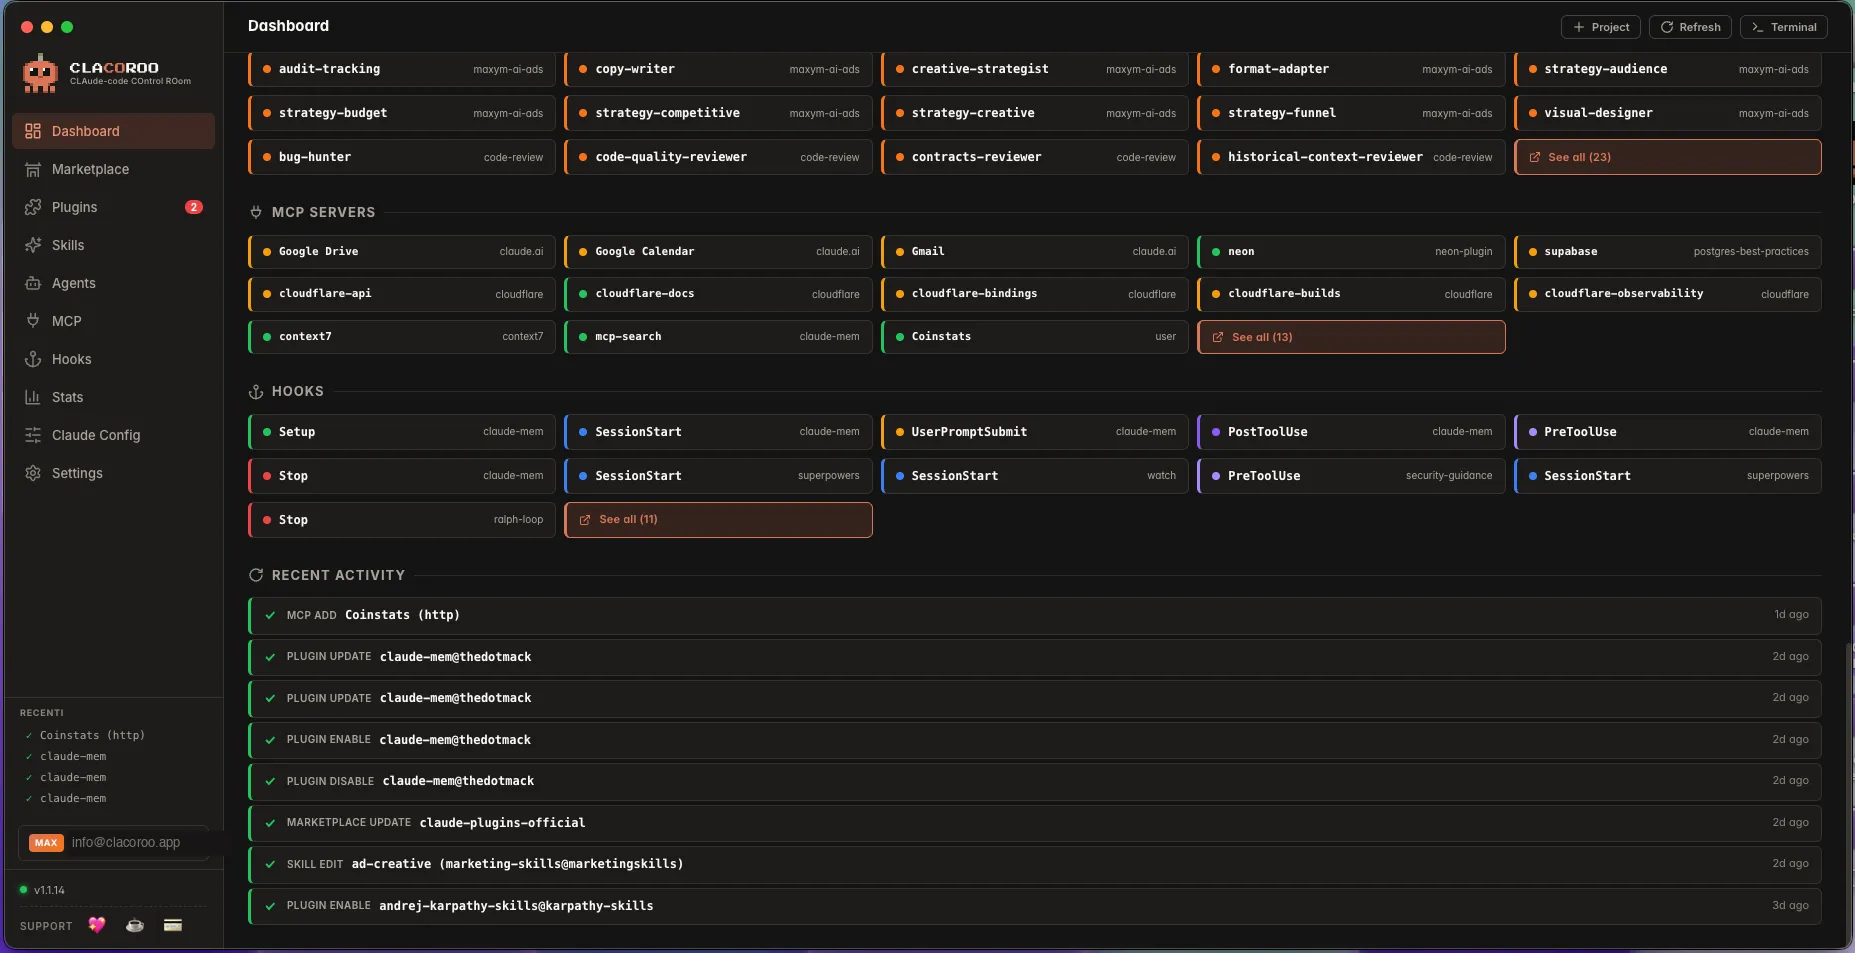
Below the cards, the dashboard repeats a compact summary of each sidebar section: the top plugins ranked by weight (with quick Disable buttons), the marketplaces you have configured, recent skills, agents, MCP servers and hooks, and a chronological Recent activity log of the actions you took recently.
The Model menu of Plugins by weight lists the current models (Opus 5.5, Opus 5, Opus 4.8, Opus 4.7, Fable 5.1, Fable 5, Sonnet 5.5, Sonnet 5, Sonnet 4.6, Haiku 5.5, Haiku 4.5). Claude Code measures plugin weights only for Opus 4.7 and Sonnet 4.6; the newer models share the tokenizer of one of the two, so CLACOROO reads that measurement and says which one under the total (e.g. “Opus 4.7 measurement (same tokenizer)” when Opus 5 is selected).
Each row links back to its full section in the sidebar, so the dashboard works as a map of your setup.
Common tasks
How to refresh the dashboard
The dashboard updates automatically when files on disk change. To force a manual reload (after running a CLI command in another window, for example):
- Click the Refresh button in the top-right of the topbar, or
- Press
Cmd / Ctrl + R, or - Open the command palette (
Cmd / Ctrl + K) and run Reload data
How to find which plugin is using the most context
- Scroll to Plugins by weight
- Read from the top: the ranking is descending by always-on token cost
- To temporarily save context, click Disable on a card — it runs
claude plugins disable <plugin>@<marketplace>and the number drops immediately
How to jump from a KPI to its section
KPI cards with a value (e.g. Hooks · 3 plugins) are clickable: a single click moves you to the corresponding section in the sidebar, already filtered when it makes sense.
How to read recent activity
The Recent activity list shows the last operations CLACOROO performed for you (enable, disable, update, install, remove, add/remove MCP, add/remove marketplace). Each row has:
- A small icon for the operation kind
- The target (plugin/marketplace/MCP name)
- A timestamp (“3 minutes ago”)
- A success/failure dot — green for success, red for failure (hover for the error message)
The same list is in the sidebar, under Recent: it starts closed to leave room for the menu on small screens, opens and closes with a click next to the count, and remembers your choice.
If you’re trying to remember “what did I just do?”, this is the place.
Tips & shortcuts
- Hover the context bar to see the exact token count for each category
- Hover the quota bars to see absolute numbers and reset timestamps
- KPI cards with
0stay in the dashboard so you know the section exists — they aren’t hidden - The Always-on tokens number is your most useful budget metric: keep it low and your context stays cheap
- The dashboard doesn’t poll: it refreshes only when files actually change on disk, so it never wastes CPU
Edge cases & errors
- The Claude quote section is missing. You aren’t logged in to claude.ai, and no API key is configured. Open Settings · Claude account to log in, or Settings · Anthropic API key to add a key.
- The context bar shows
—or stays at 0. Claude Code hasn’t written a context cache yet. Open a Claude Code session, send a message, then click Refresh. - Statistics are zero across the board. Either Claude Code is freshly installed, or its session logs live somewhere CLACOROO can’t read. Make sure CLACOROO can read
~/.claude/(or%APPDATA%\Claude\on Windows). - Health issues count is high. Click the KPI to open the Doctor: it lists every item with the problem and suggests what to do.
Related
- Plugin manager — the section where you act on the Plugin KPIs
- Stats — the deeper version of the Claude Code usage cards (per model, per project, history)
- MCP servers — the section behind the MCP connected card
- Hooks — the section behind the Hooks card
- Claude account — what powers the Claude quote bars