Sessions
The Sessions section is your personal browser for all the work sessions Claude Code has saved in ~/.claude/projects/. CLACOROO reads the JSONL files directly on your machine and organises them into a two-level navigable view, without touching the network.
Overview: projects and sessions
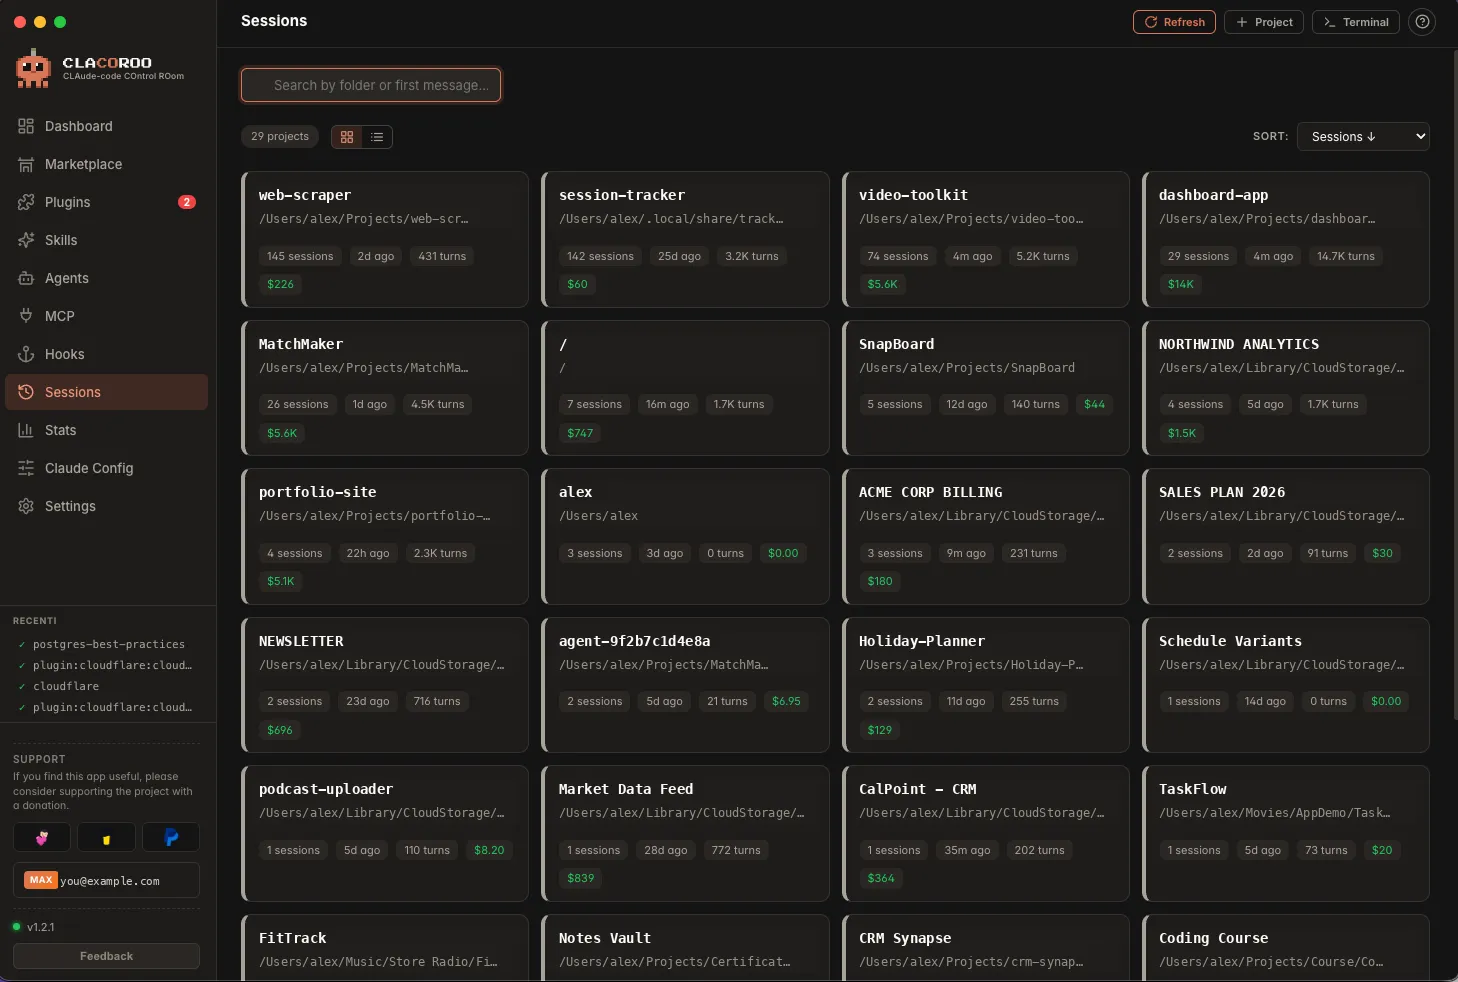
The main screen shows a project grid: each card represents a distinct working folder (the cwd Claude Code was launched from) and summarises at a glance:
- Short name of the folder (prominent) and full path below in monospace
- Number of sessions recorded in that folder
- Total estimated API cost across all sessions in the folder
- Total assistant turns in the folder
- Last activity: exact date and time of the most recently modified session
Click a project to drill into level 2: the list of its sessions. A breadcrumb ”‹ Projects / folder name” appears at the top to return to the project grid with one click.
Level 2: sessions in a project
Each session card shows:
- First message of the session, truncated to two lines (IDE tags and
/watchskill output are skipped automatically for a cleaner preview) - Exact creation and last-modified date and time (alongside the relative “x days ago” format)
- Assistant turns in the session
- Estimated API cost based on the session’s tokens
Global search
The search field at the top of the screen works across all projects at once:
- Empty field: shows the project grid (level 1)
- Text typed: flat list of all matching sessions from any project, filtered in real time
The search checks the project folder name and the text of the first message. The counter shows how many sessions match.
Sorting projects
In the project grid you can sort by:
- Last activity (default, most recent first)
- Creation date
- Total cost
- Number of sessions
Reading the transcript
Click any session: a transcript modal opens with the conversation in readable form.
The transcript uses windowing: it loads 40 entries at a time, then appends the next batch as you scroll to the bottom. Even sessions with hundreds of turns stay responsive.
Each conversation entry is labelled by role (user, assistant, tool). Tool calls are collapsed by default: click one to expand it and read the full input and output without cluttering the view.
Actions
Inside the modal, four buttons let you act on the session:
- Resume in internal terminal: opens CLACOROO’s built-in terminal and runs
claude --resume <session-id>, dropping you straight back into that session’s context - External terminal: opens the system terminal in the project folder (iTerm / Terminal on macOS, the default terminal on Windows and Linux); the resume command is already in the clipboard
- Copy command: copies
claude --resume <session-id>to the clipboard, ready to paste wherever you like - Open folder: opens the project folder in the system file manager
Privacy
Session data never leaves your machine. CLACOROO reads the JSONL files directly from ~/.claude/projects/ (or the Windows equivalent), computes cost and turns locally, and makes no network calls to display this section.
Edge cases
- Session with no first message. Some sessions start with a tool call before any user message, or were created via API. In that case the card shows “No text” instead of a first message.
- Session still open. If Claude Code is currently writing to the JSONL, the most recent turns may not appear yet. Press Refresh in the topbar to re-read the files from disk.
- Cost showing zero. Very old sessions or sessions run with models not in the pricing table will not show an estimated cost: this is expected.
- No sessions in the list. Either Claude Code has not created any sessions yet,
~/.claude/projects/is empty, or CLACOROO does not have read permission on that folder.