Stats
The Stats section is the extended version of the Claude Code Usage cards on the Dashboard. It reads the session JSONL files Claude Code writes locally and turns them into a real usage report: how many sessions, how many tokens, which model, which project, what it cost, what drove the usage, and how efficient the cache was.
The numbers are computed live from the transcripts, not from a cache that can lag behind: every time you open the section it re-scans the sessions on disk. And it all happens on your machine — CLACOROO makes no remote call to produce these numbers.
Overview
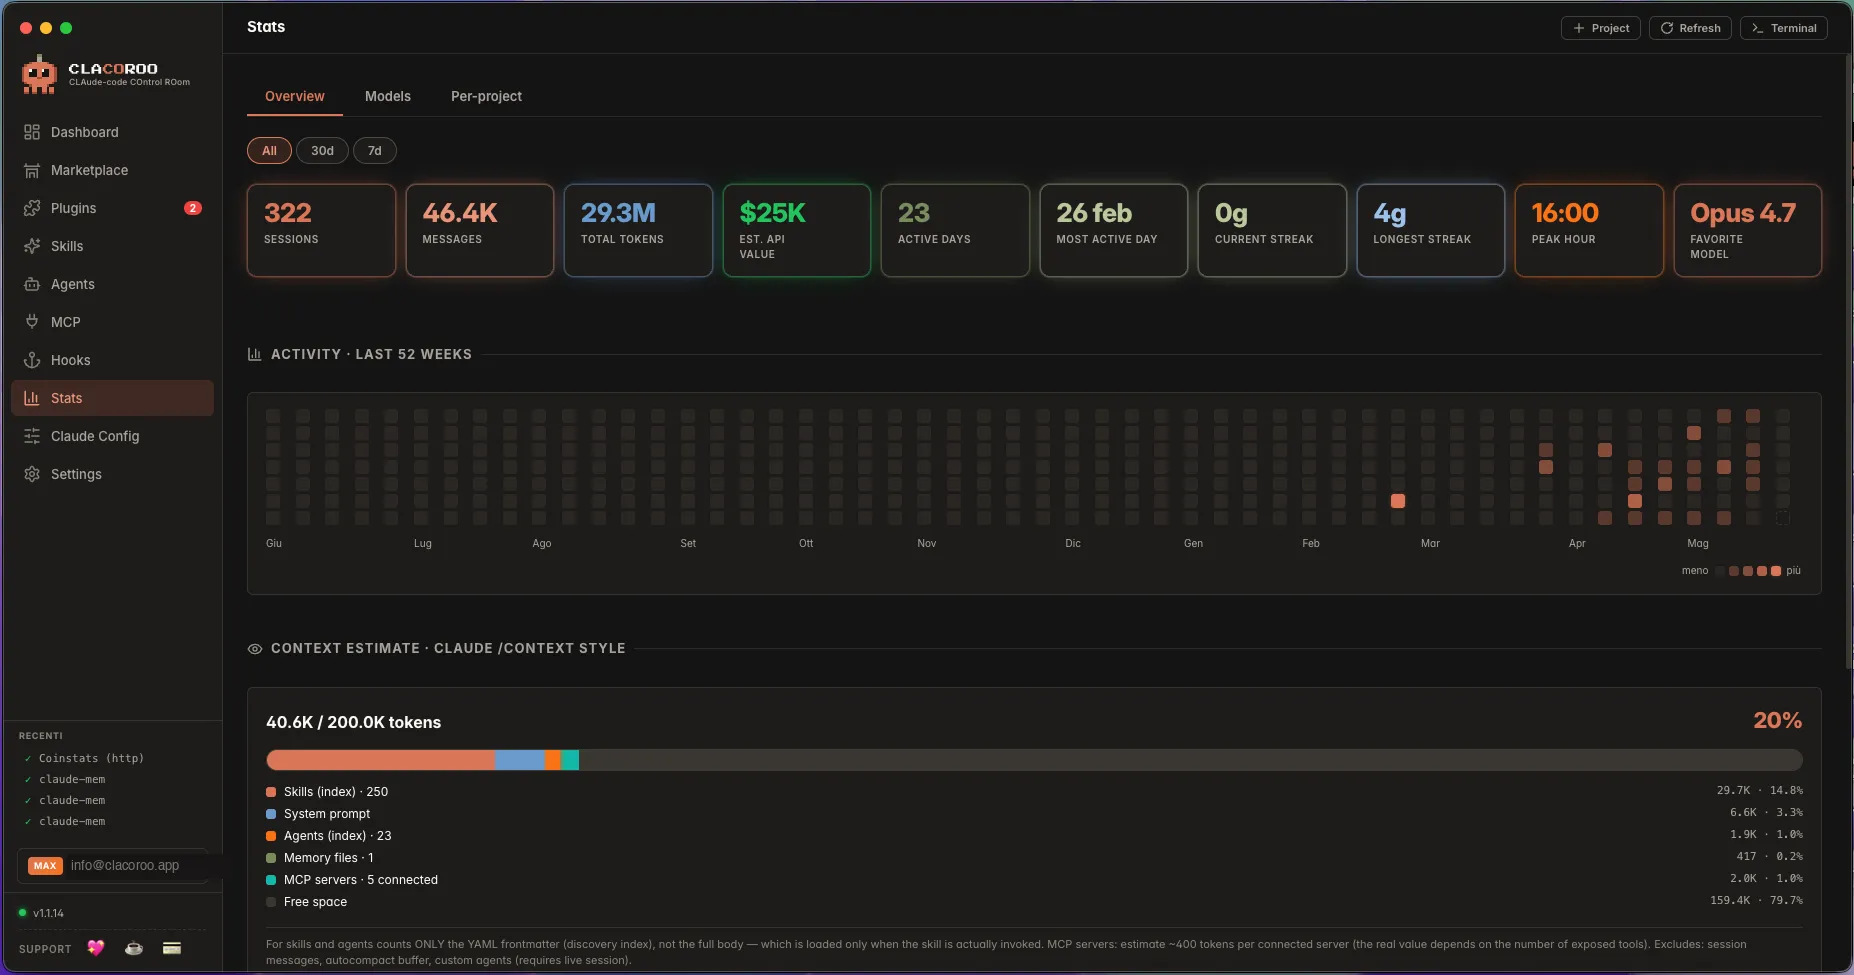
Stats is organized into tabs:
- Overview — the headline numbers, the transparent token breakdown and the activity heatmap
- Claude Quota — the live limit bars plus what’s contributing to your usage
- Models — usage and cost broken down by model
- Per-project — usage and cost broken down by project (folder)
- Attribution — how much cost is attributable to each plugin / skill / agent / MCP server, plus the main-session vs subagent split
- Efficiency — cache hit ratio, average context, heavy turns and most-used tools with error rate
Every live tab is scopeable by time range: All time · last 30 days · last 7 days — heatmap, bars, attribution, efficiency and tools rescale accordingly. (The Claude Quota tab uses its own Day / Week switch instead.)
Tokens: “work” vs cache (the figure in plain sight)
A number like “83 million tokens” is almost always misleading: 90%+ of it is cache read — context re-read at very low cost that inflates the totals but barely moves them. That’s why CLACOROO doesn’t show one billions-large number. It distinguishes:
- Work tokens = input + output: what you actually produce (new prompts + responses). This is the headline number.
- Cache read = context re-read from cache (cheap).
- Cache write = context stored in cache the first time.
The Tokens, in plain sight card in the Overview keeps the four types separate and explains the cache share, so you can see at a glance how much of the total is real work and how much is just re-read context.
What it shows
Overview tab
Top row: a tiling of headline KPIs —
- Sessions — Claude Code sessions in the range
- Turns — assistant turns (model responses)
- Work tokens — input + output, cache excluded
- Real API cost — what the tokens would have cost on the API, computed from the prices for each token type (input, output, cache write/read)
- Active days and Most active day
- Current streak / Longest streak — consecutive days of usage
- Peak hour — the time of day you use it most
- Favorite model — the model you used most
Below the KPIs: the Tokens, in plain sight card (see above) and an activity heatmap — each day in the range, colored by turn intensity (GitHub-contribution-style chart). Hover a square for the exact count.
Claude Quota tab
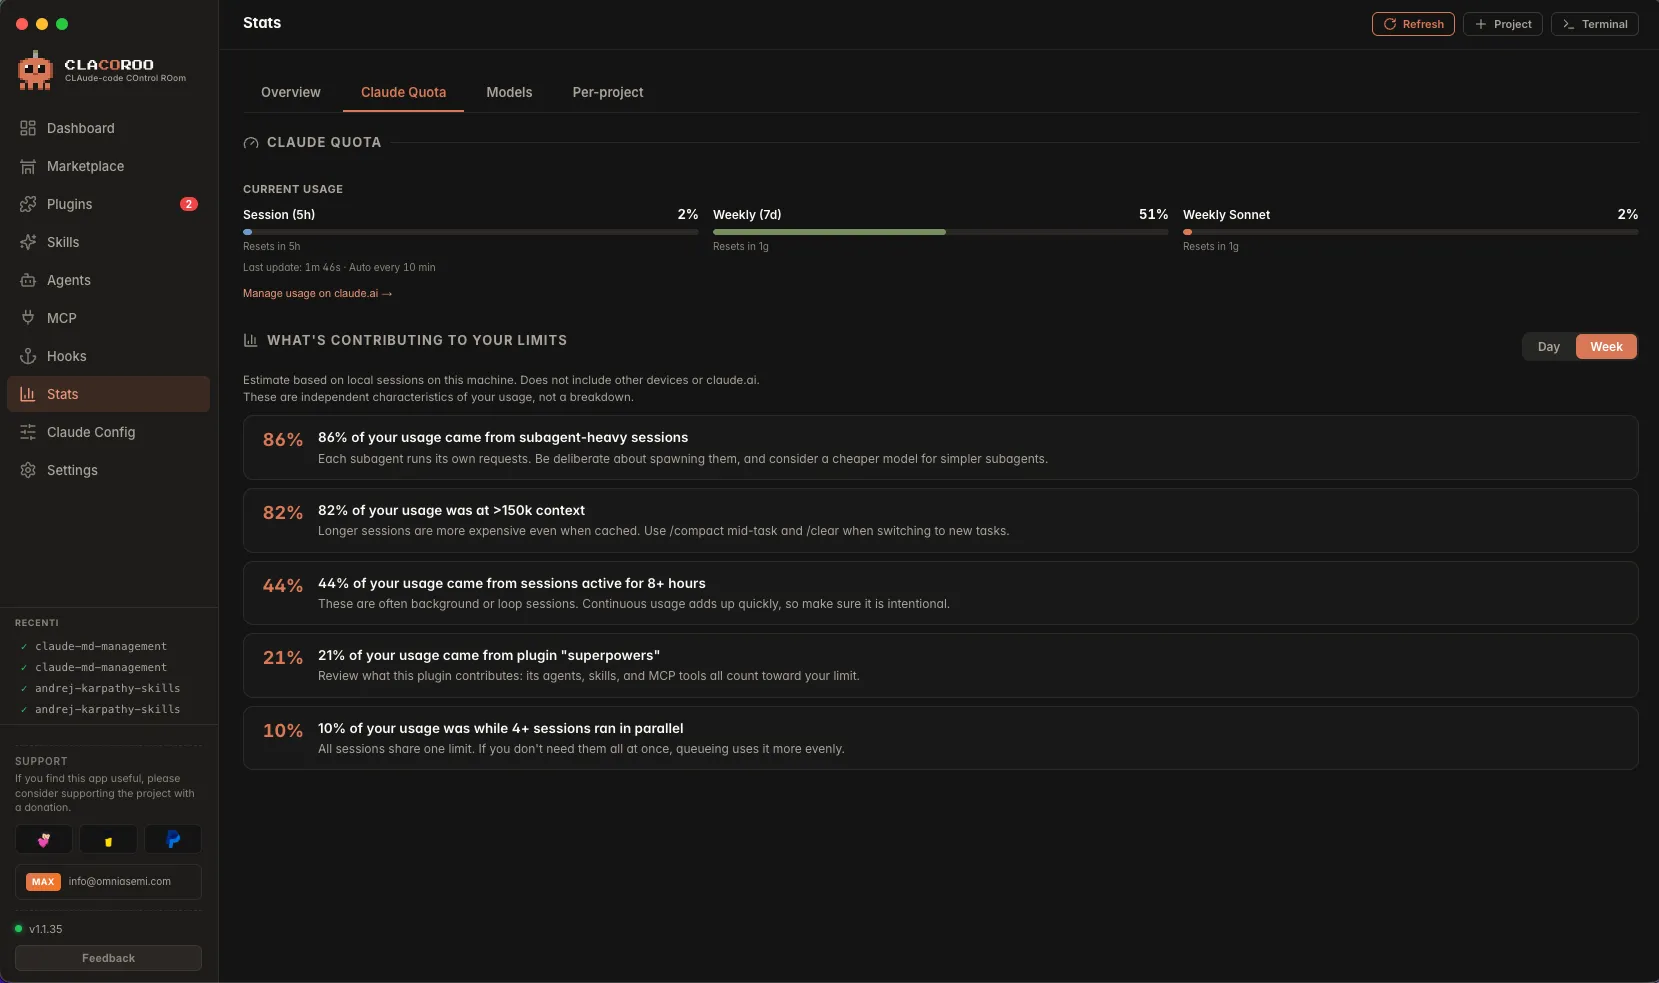
This tab mirrors Claude Code’s own /usage panel, in two parts.
Current usage — your Claude plan’s limit bars:
- Session (5h) — the rolling 5-hour window
- Weekly (7d) — the 7-day window
- Weekly Sonnet — the separate Sonnet 7-day window
Each bar shows the percentage used and when it resets. They come from Claude’s usage endpoint, so opening this tab makes an on-demand call — the same data, on the same per-account shared rate limit, that Claude Code uses. By default CLACOROO does not poll this endpoint in the background (see Refresh modes below).
What’s contributing to your limits — an estimate, computed entirely on your machine by scanning the local session transcripts, of which behaviors and plugins are driving your usage. Toggle between Day (last 24h) and Week (last 7 days). Each row is a share of your cost-weighted usage:
- context >150k — turns with a very large context (expensive even with cache)
- subagent-heavy sessions — usage from sessions that spawned many subagents
- 8+ hour active sessions — long sessions, often in the background or in a loop
- 4+ parallel sessions — usage produced while multiple sessions ran together
- uncached input >100k — turns with a large fresh (uncached) input
- plugin “name” — usage attributable to a specific plugin (its skills, agents, MCP tools)
These are independent features, not a breakdown — they can overlap and exceed each other, so the percentages don’t sum to 100%. Only items above ~10% are shown.
Privacy. The “what’s contributing” list never leaves your machine: it’s read from
~/.claude/projects/locally, with zero network calls. It’s an estimate aligned with Claude Code’s/usagepanel, not a bit-identical copy — the exact time windows differ slightly.
Refresh modes and the shared rate limit
The Current usage bars are the only part of CLACOROO that talks to your Claude account, and they share Claude Code’s per-account rate limit. So CLACOROO doesn’t erode that budget while it sits open, quota polling is Manual by default: the bars only refresh when you open this tab (or the Dashboard / Account panel) or press Refresh. You can change the cadence — or leave it manual — in Settings → Quota refresh frequency.
CLACOROO also never renews the Claude login token, so it can’t disturb the session Claude Code is using.
Models tab
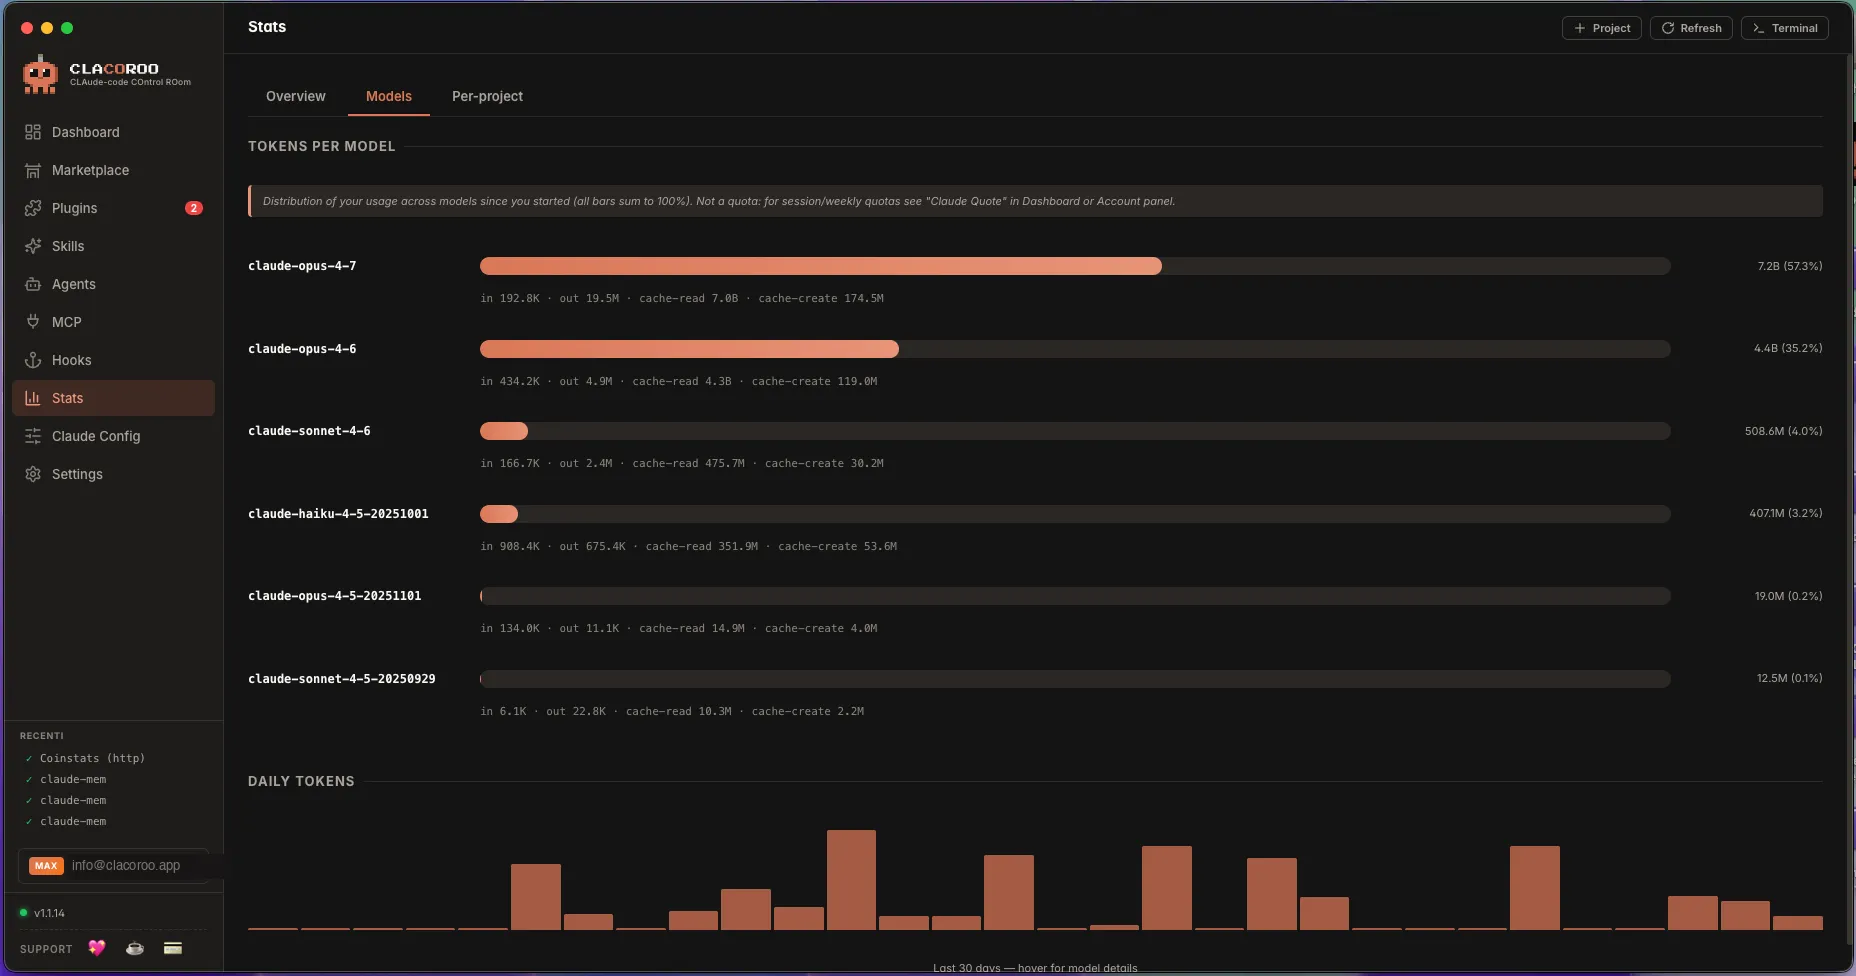
A tokens-per-model breakdown with, next to each model, the real $ cost: one bar for the usage share, plus the daily token histogram for the range. If you use Sonnet 80% of the time and Opus 20%, you see it here — and it’s the easiest place to catch a sudden change (e.g. accidentally switching to an expensive model).
Per-project tab
A breakdown of usage per project folder. Claude Code records each session’s working directory; CLACOROO groups them and shows, per project:
- Folder name (and full path)
- Work tokens (input + output, cache excluded)
- Real API cost
- Turns and distinct sessions
Useful for splitting one project’s cost from another, or learning where your assistant’s time really goes.
Attribution tab
The tab Opcode doesn’t have. Claude Code transcripts tag each turn with the plugin / skill / agent / MCP server that generated it; CLACOROO aggregates that into $ cost per item:
- Main vs subagent — how much cost comes from the main flow and how much from subagents (Task/Agent), with the number of turns run by subagents
- Subagents by type — how many calls and how many tokens per agent type
- Cost per plugin / skill / agent / MCP server — the most expensive items, sorted
It’s the most direct way to discover which automation is costing you the most.
Efficiency tab
How well you’re using cache and context:
- Cache hit (read / input) — how much of the context is re-read from cache (cheap) instead of re-sent
- Average context per turn and turns over 150k tokens — how “heavy” your sessions are
- Tool success (non-error) — the share of tool calls that succeeded
- Most used tools — the tools you use most in the range, with the total of errored results
Common operations
How to see what last week cost
- Open the Overview tab
- Switch the range to 7d
- Read the Real API cost card — it’s the off-API price equivalent for the last 7 days
Note. The cost is based on Anthropic’s public pricing for each token type. It’s an approximation, not an invoice — if you have a claude.ai subscription, the real cost is the subscription’s, whatever you do.
How to learn which model (or plugin) is eating the budget
- Open the Models tab for cost per model, or Attribution for cost per plugin / skill / agent / MCP
- The top row is your main consumer
- If it’s something you didn’t plan for, it’s worth finding out why
How to tell whether the cache is working for you
- Open the Efficiency tab
- Read Cache hit — the higher it is, the more context is re-read cheaply instead of re-sent
- If it’s low and Average context is high, your sessions are re-sending a lot of fresh context:
/compactor shorter sessions help
How to compare projects
- Per-project tab
- The top rows (sorted by cost) are where the assistant’s time goes
How to see what’s driving your usage
- Open the Claude Quota tab
- Toggle between Day and Week
- Read the what’s contributing list — the top row is the biggest lever
If one behavior or plugin dominates, that’s where to act: a cheaper model for subagents, /compact on long-context sessions, or queueing parallel runs instead of launching them all at once.
How to refresh stats
Stats are computed from disk every time you open the section. To force a recompute (after a long session you want to see right away):
- Click Refresh in the topbar, or
- Press
Cmd / Ctrl + R
Tips and shortcuts
- Look at “work tokens”, not the raw total: the total is dominated by cache read and doesn’t tell you how much you actually produced
- Hover the heatmap for the exact turn count of the day
- The streak counters are based on whole days — skip even one day and the streak resets
- The API cost uses the current public pricing for each model and token type: if Anthropic ships new prices, history re-prices on the fly
- The Models tab is the fastest “what changed?” signal — a new model suddenly dominating is usually a config drift to investigate
- Switch to 7d when you want a quick “this week” glance without the noise of history
Edge cases and errors
- Everything is zero. Either Claude Code is freshly installed (no sessions yet), or its session logs live somewhere CLACOROO can’t read. Make sure CLACOROO can access
~/.claude/projects/(macOS/Linux) or the equivalent Windows path. - A project shows the wrong name. Stats uses the working directory; if you renamed the folder after the session, the old name persists in the JSONL. The full path confirms which folder it was.
- Token counts don’t match my claude.ai dashboard. Local logs and the cloud subscription dashboard can differ — they measure slightly different things and update at different times. Use CLACOROO as a consistent local trend rather than an authoritative invoice.
- The heatmap is empty for recent days. Session JSONL files are flushed when Claude Code closes a session. If a session is still open, its turns won’t appear until you close it.
- A model I don’t use shows up in the breakdown. A plugin or agent may have forced it for a specific call — the Attribution tab helps you see where it came from.
- The Attribution tab is nearly empty. Normal: transcripts tag plugin/skill/agent/MCP only when they’re actually invoked in a turn. If you work mostly “by hand”, there’s little to attribute.
- The Claude Quota bars show “paused” or an error. Usually the Claude login token expired or you hit the shared rate limit. Use Claude Code once to renew the token, then press Refresh. CLACOROO doesn’t renew the token itself, by design.
- The “what’s contributing” percentages differ a bit from Claude Code’s
/usage. Expected: both scan the same local sessions, but the exact time windows and snapshot moment differ. Treat it as an aligned estimate, not an identical value.
Related
- Dashboard — the compact KPI version of this section
- Quota notifications — when these usage numbers cross a threshold, you get a system notification
- Claude account — account info, which affects how quotas are reported
- Concepts — what Claude Code logs locally, and why